
LLM Evaluation Metrics You Should Know
Deploying artificial intelligence into production environments requires a bulletproof validation framework. Engineering teams must understand how to measure and track llm performance metrics to ensure system dependability.
In this guide, we provide a complete llm evaluation metrics explained overview, diving deep into foundational llm accuracy metrics and modern automated evaluation frameworks. Whether you need a standardized llm evaluation scorecard for an enterprise implementation or an engineering framework to track day-to-day llm metrics, mastering these benchmarks is essential for scaling AI responsibly.
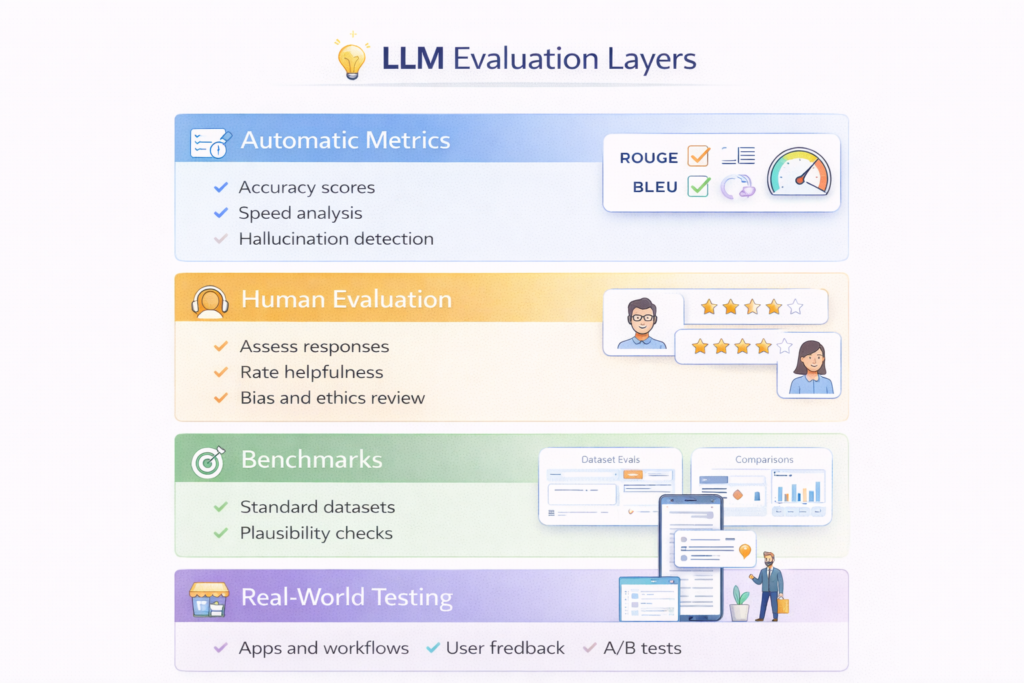
The most important LLM evaluation metrics include perplexity, BLEU, ROUGE, accuracy-based benchmarks, and human evaluation. Each metric measures a different aspect of performance, and no single metric is enough on its own.
In simple terms
Validating the output quality of generative systems is one of the most critical engineering challenges in production AI deployment. Moving forward with 2026 llm evaluation standards and metrics requires a deliberate shift away from purely deterministic math checks and toward programmatic, semantic alignment tracking.
In this guide, we break down foundational evaluation metrics for large language models, analyzing how system architects map out deterministic, semantic, and LLM-as-a-Judge validation systems. Whether you are trying to understand how to evaluate llm performance across multi-department pipelines or looking for objective llm accuracy metrics to de-risk an enterprise rollout, these methodologies convert abstract language capabilities into measurable, verifiable performance logs.
LLM evaluation answers one question:
“How good is this model at doing what I need?”
But “good” depends on the task:
- writing → fluency and coherence
- coding → correctness
- QA → accuracy
- chat → usefulness
That’s why multiple metrics exist.
Why LLM evaluation is difficult
Traditional ML models are easier to evaluate because outputs are structured.
LLMs are harder because:
- outputs are open-ended
- multiple answers can be correct
- quality is subjective
- hallucinations are hard to measure
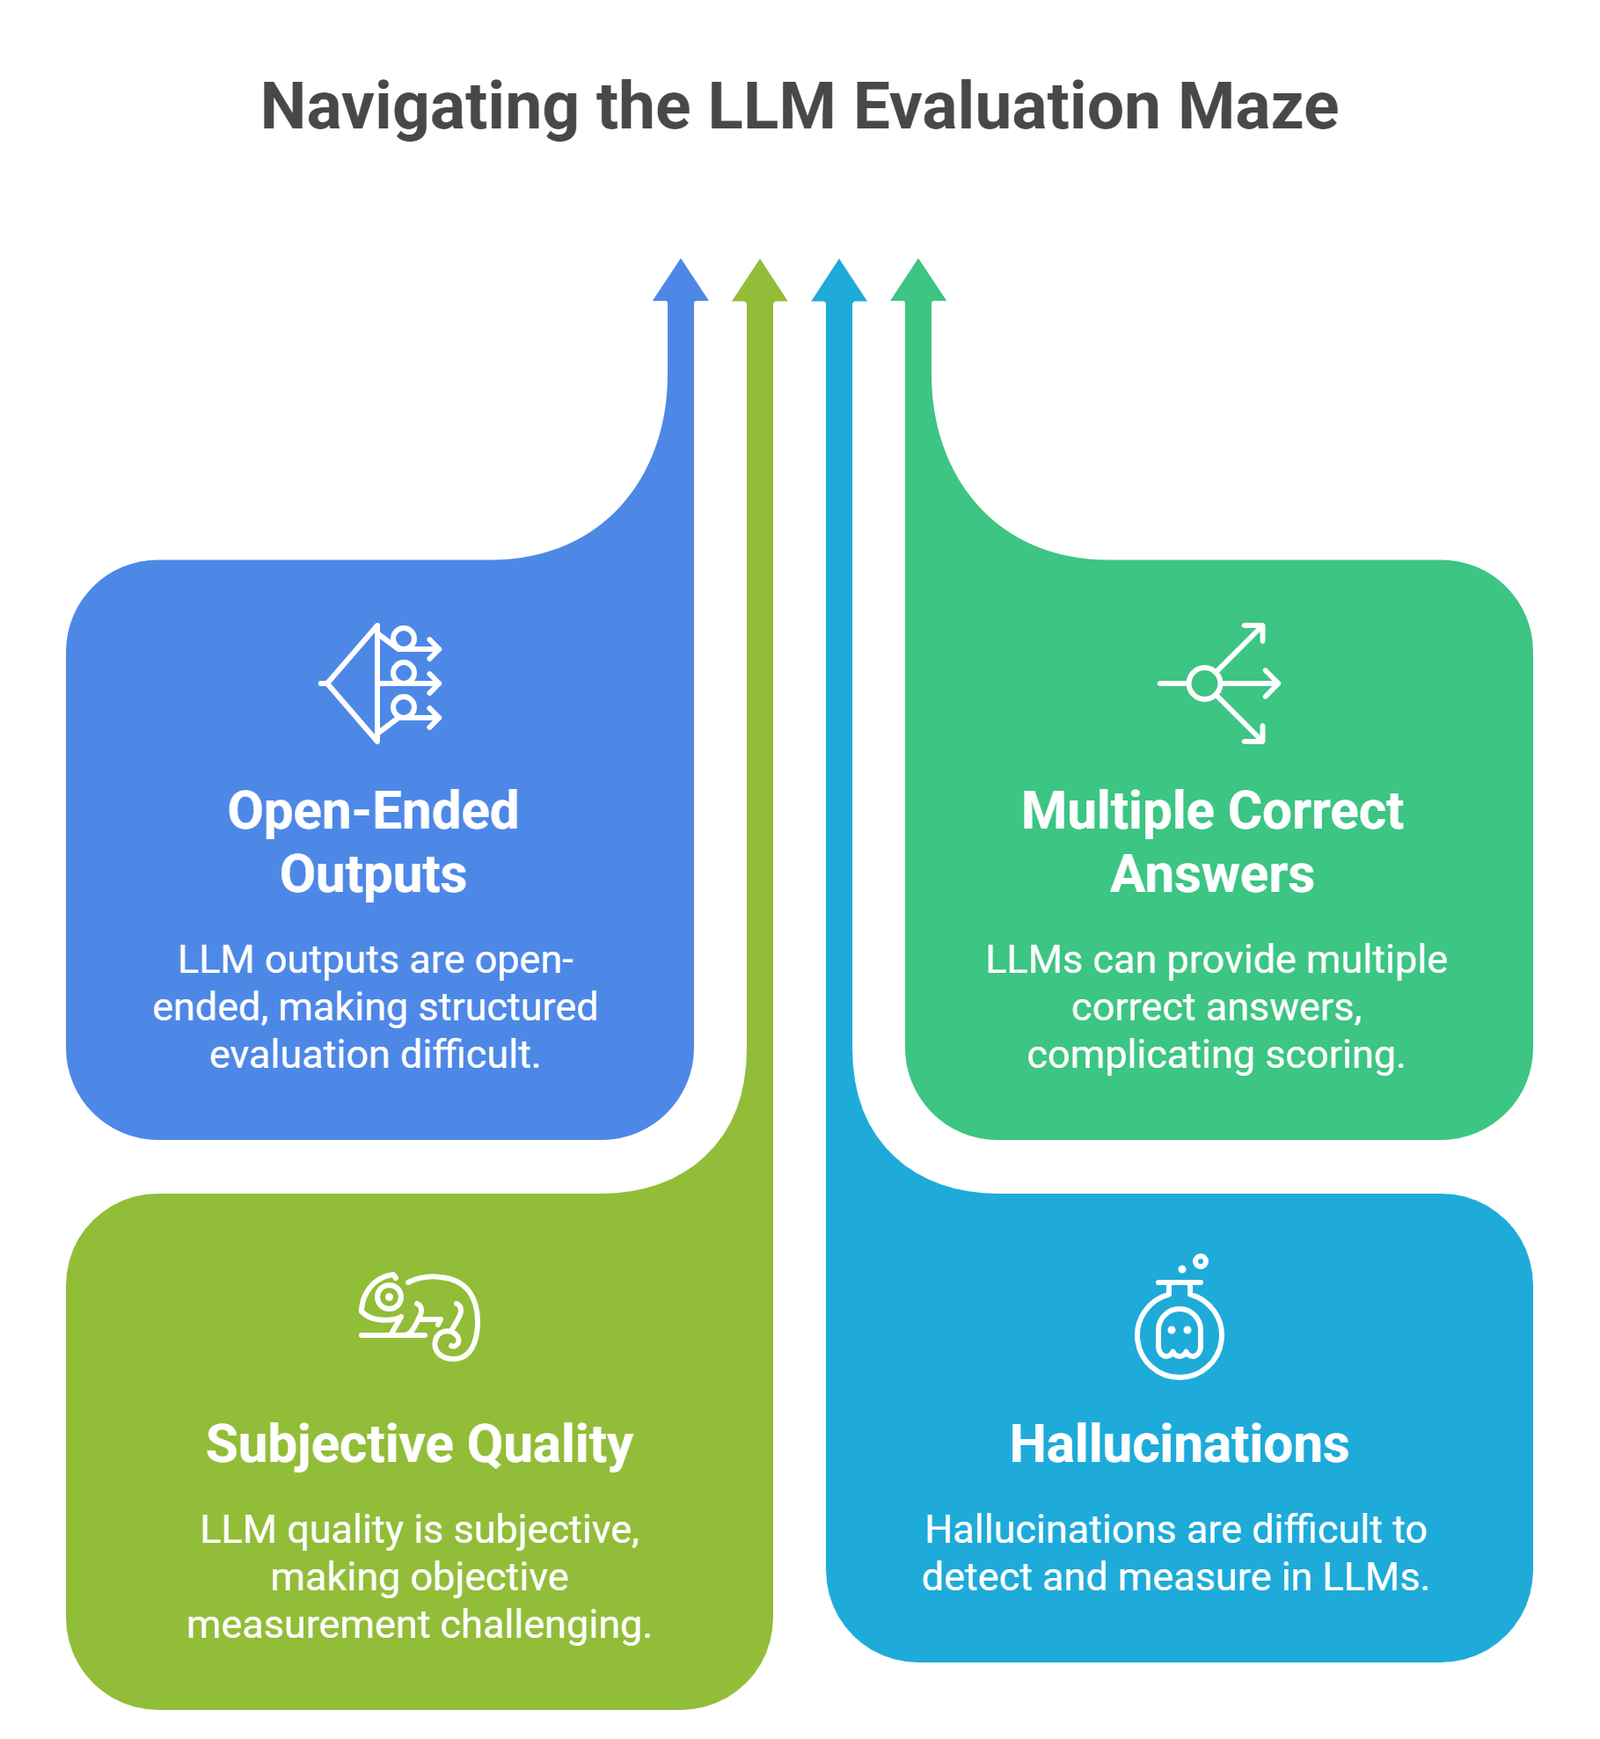
This is why evaluation combines automatic metrics + human judgment + benchmarks.
Understanding Traditional LLM Metrics: BLEU and ROUGE Score LLM Applications
Historically, machine learning engineers relied heavily on classical n-gram alignment tools like the bleu metric llm engineers used for translation tasks, or the rouge llm evaluation standard designed for summary parsing.
However, relying strictly on standard bleu and rouge limitations for open-ended text generation evaluation is a major pitfall. While helpful for basic validation, these structural constraints struggle when applied to creative agent outputs.
For instance, bleu rouge limitations open-ended tasks center on the fact that they only measure exact phrase overlapping rather than semantic intent. If an LLM answers a query accurately using completely different vocabulary synonyms, a standard rouge score llm calculator will penalize the response, failing to reflect true llm quality evaluation metrics accurately.
Linguistic Overlords: BLEU and ROUGE Score Fundamentals
When beginning to explore how is llm performance measured, traditional machine translation baselines like bleu and rouge are often the first stop. The bleu metric llm engineers deploy computes n-gram precision to measure how many word fragments in the generated text match a human-written ground truth script. Conversely, a rouge score llm evaluates n-gram recall, tracking how much of the target reference text was successfully captured by the model.
The Structural Limitations for Open-Ended Tasks
While these string-matching algorithms work well for rigid code extraction or exact translations, heavy bleu and rouge limitations for open-ended text generation evaluation become glaringly obvious in conversational systems. Because these calculators rely on exact character strings, they fail to grasp semantic meaning.
If a model outputs a flawless, hyper-accurate answer using synonyms or a completely different phrasing layout than the reference script, its bleu llm evaluation score will plumet to zero. Recognizing these bleu rouge limitations open-ended tasks present is why modern engineering groups are rapidly transitioning toward embedding-based alignment systems like BERTScore and automated LLM-as-a-Judge evaluation rigs.
Core LLM Evaluation Metrics
1. Perplexity
What it measures:
How well a model predicts the next word.
Lower = better
Example:
A model with lower perplexity generates more natural text.
When to use:
- language modeling
- comparing base models
Limitation:
Does not measure correctness or usefulness.
2. BLEU (Bilingual Evaluation Understudy)
What it measures:
Overlap between generated text and reference text.
Best for:
- translation
- structured generation tasks
Example:
Comparing generated translation with a ground-truth sentence.
Limitation:
Fails for creative or flexible outputs.
3. ROUGE (Recall-Oriented Understudy for Gisting Evaluation)
What it measures:
Overlap in summaries (recall-focused).
Best for:
- summarization tasks
Example:
Comparing generated summary with human-written summary.
Limitation:
Does not capture meaning well.
4. Accuracy / Exact Match
What it measures:
Whether the output is exactly correct.
Best for:
- question answering
- classification
- coding tasks
Example:
Did the model return the correct answer?
Limitation:
Too strict for open-ended tasks.
5. F1 Score
What it measures:
Balance between precision and recall.
Best for:
- QA tasks
- entity extraction
Example:
Partial correctness scoring.
6. Human Evaluation
What it measures:
Real human judgment of output quality.
Criteria include:
- usefulness
- coherence
- correctness
- tone
Best for:
- chat systems
- content generation
Limitation:
Expensive and subjective.
7. Hallucination Rate
What it measures:
How often the model generates incorrect facts.
Best for:
- factual QA
- enterprise applications
Example:
Tracking false statements in outputs.
8. Toxicity and Safety Metrics
What it measures:
Harmful or biased content.
Best for:
- public-facing systems
9. Latency and Cost
What it measures:
- response time
- inference cost
Best for:
- production systems
10. Benchmark Scores
Popular benchmarks include:
- MMLU (knowledge tasks)
- HumanEval (coding)
- HELM (holistic evaluation)
Best for:
- comparing models
Limitation:
Benchmarks ≠ real-world performance.
Linguistic Correctness: Fluency Metrics LLM and RAG Strategy
When determining which evaluation metric measures linguistic correctness and natural language quality, automated evaluations look closely at syntax structure. Implementing fluency metrics llm rag developers track ensures that the output text flows naturally and contains zero structural grammar fragmentation.
Moving beyond basic text flow, companies must deploy objective metrics for measuring helpfulness and relevance in llm responses. This involves utilizing an llm evaluation rubric or specialized llm scoring systems powered by an evaluation judge (LLM-as-a-Judge) to grade if the retrieved data context directly answers the user’s problem statement.
Comparison Table
| Metric | Best for | Strength | Weakness |
| Perplexity | Language modeling | Simple comparison | Not task-specific |
| BLEU | Translation | Easy scoring | Rigid |
| ROUGE | Summarization | Widely used | Shallow |
| Accuracy | QA | Clear results | Too strict |
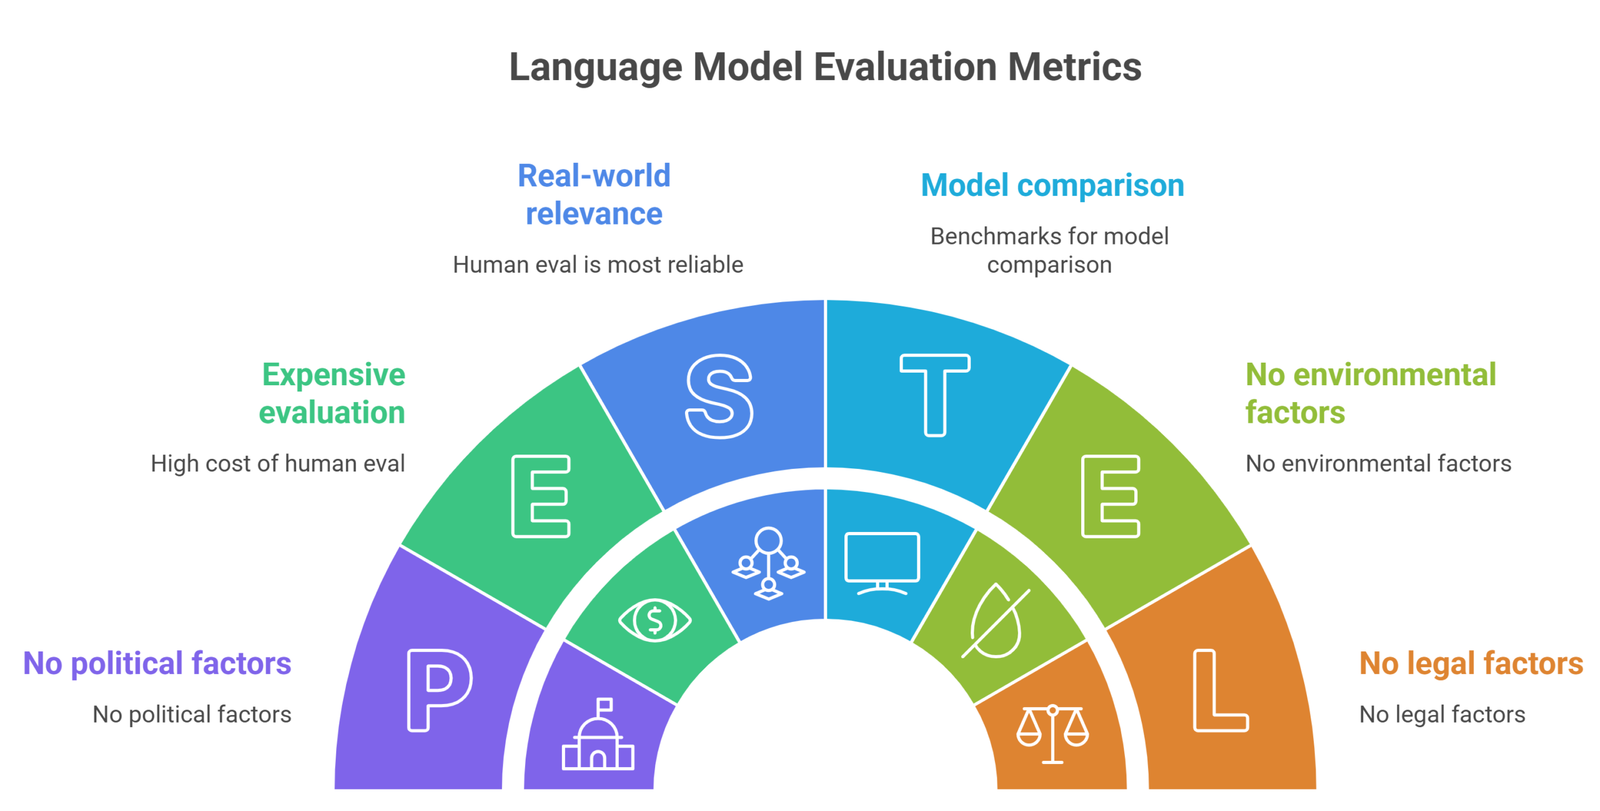
| Human eval | Real use | Most reliable | Expensive |
| Benchmarks | Model comparison | Standardized | Limited realism |
Developing a Sustainable QA Evaluation LLM Strategy
Building an effective llm evaluation strategy isn’t just about a one-time check; it requires continuous llm accuracy tracking. If you are trying to solve how do i compare enterprise ai vendors for accuracy, you need to combine standard llm inference performance metrics (like latency per token) with custom llm reliability metrics.
Laying out a clear llm scoring rubric allows your automated pipelines to execute continuous llm accuracy testing, guarding against model degradation or regressions when swapping out foundational base model backends.
When to use which metric
| Use case | Best metrics |
| Chatbots | Human eval + hallucination |
| Summarization | ROUGE + human eval |
| Translation | BLEU |
| Coding | Accuracy + benchmarks |
| RAG systems | Retrieval accuracy + hallucination |
Real-world evaluation strategy
In practice, teams combine metrics:
automatic metrics (fast)
benchmark testing (standard)
human evaluation (quality)
production feedback (real-world)
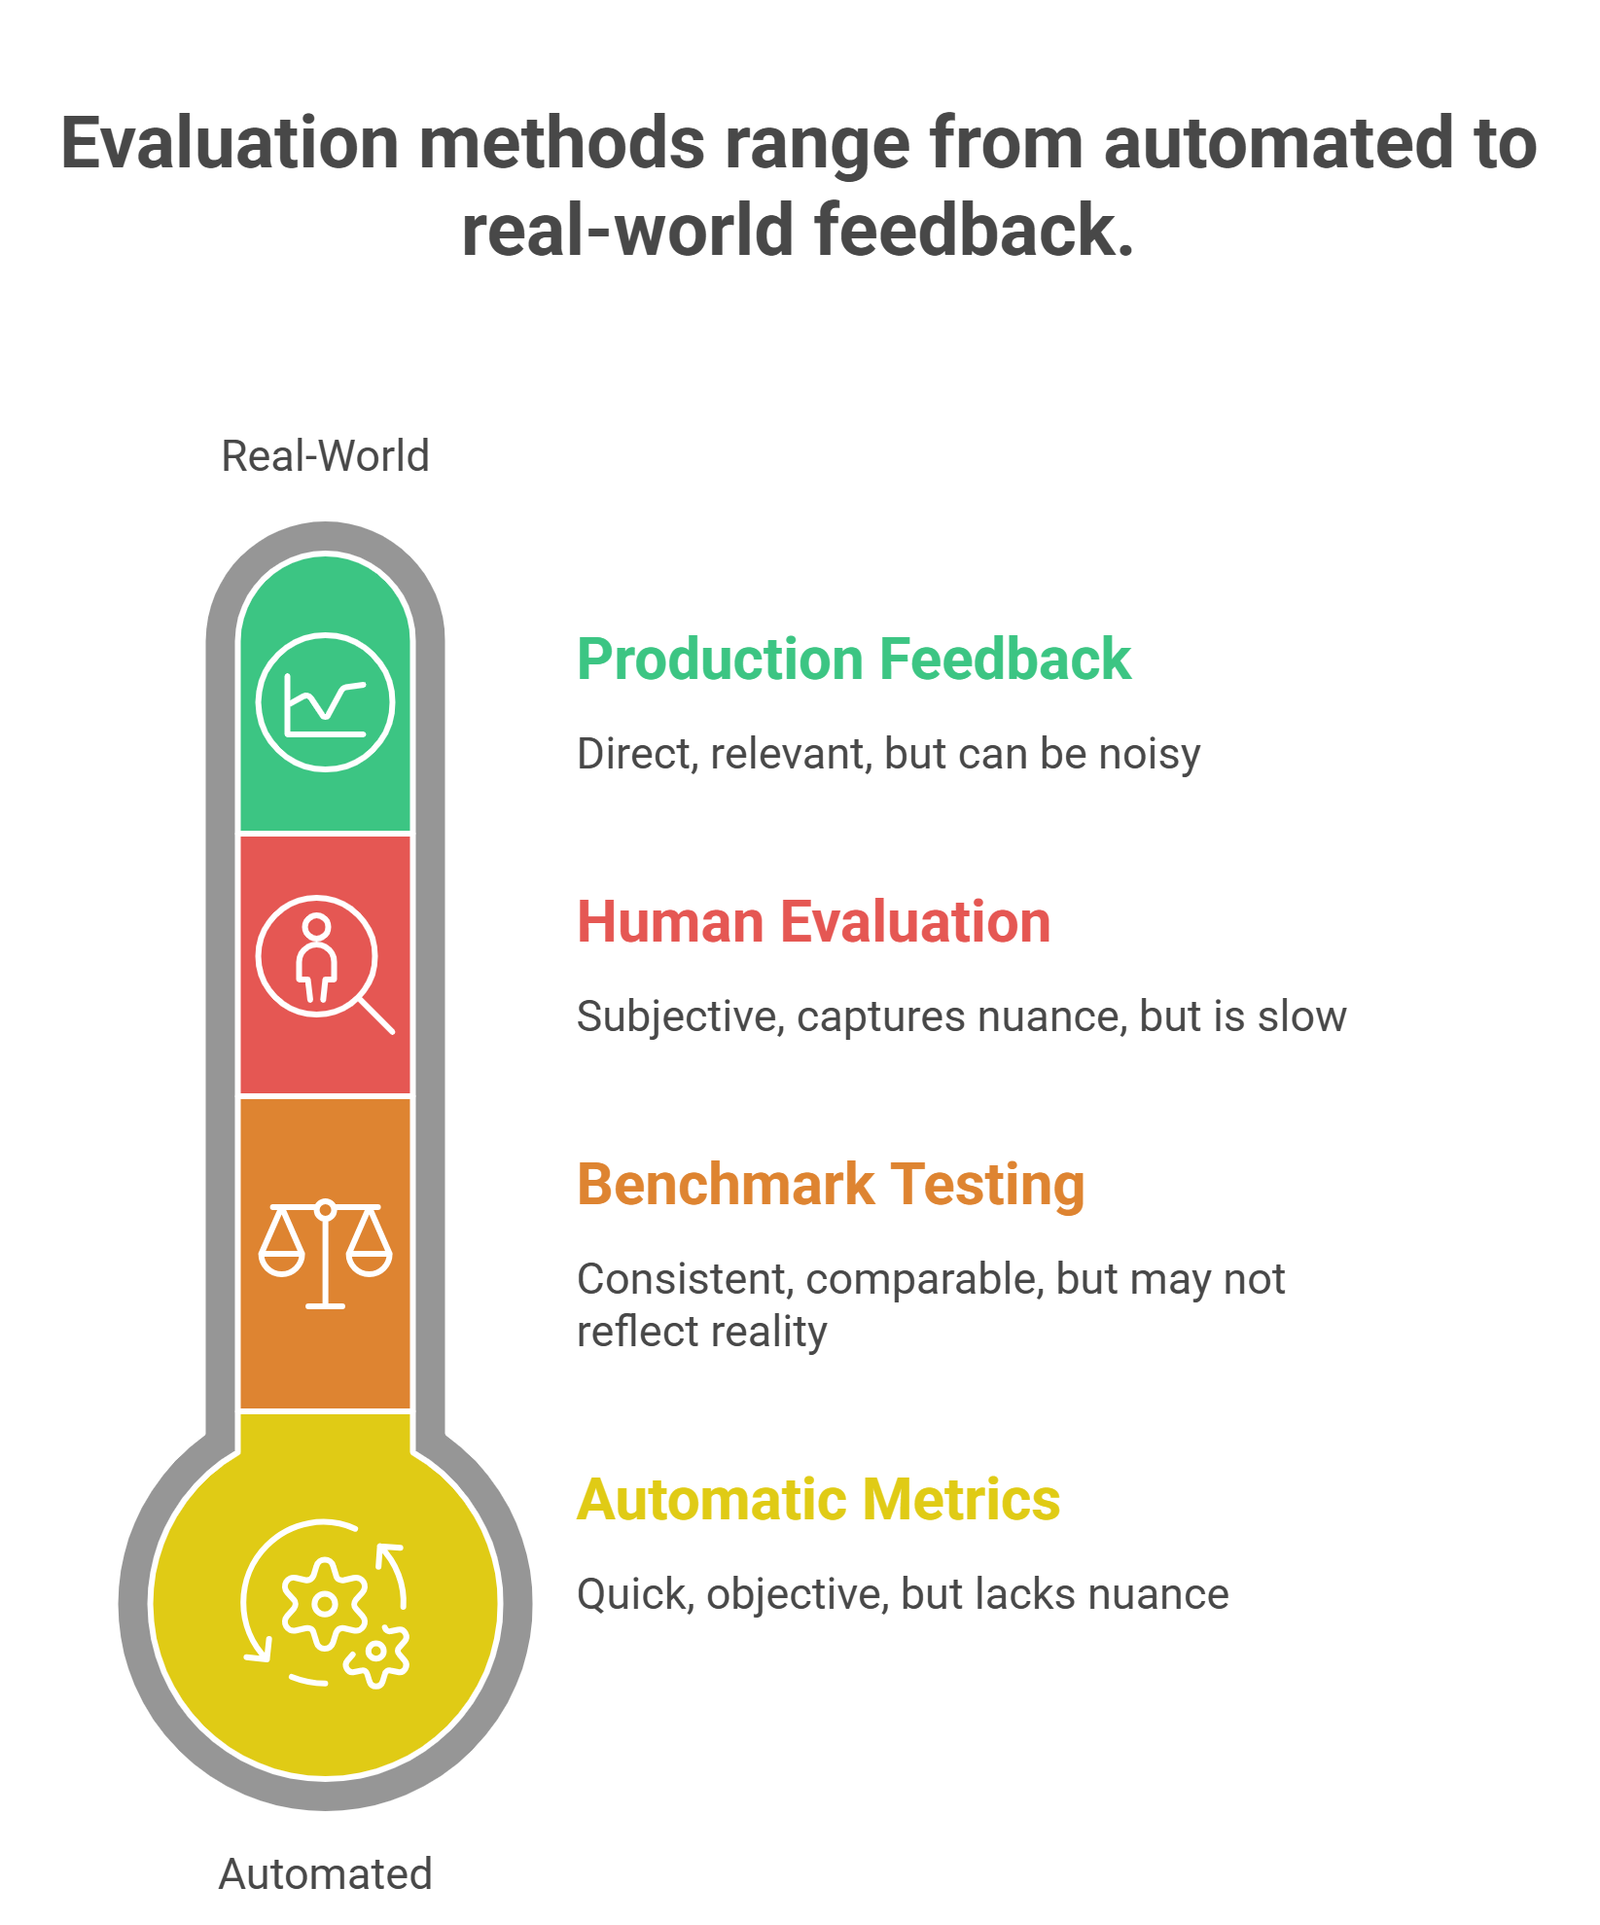
This layered approach is what most modern AI systems use.
Common mistakes: LLM Evaluation Metrics
- relying on a single metric
- over-optimizing benchmarks
- ignoring human feedback
- not testing real use cases
- confusing fluency with correctness
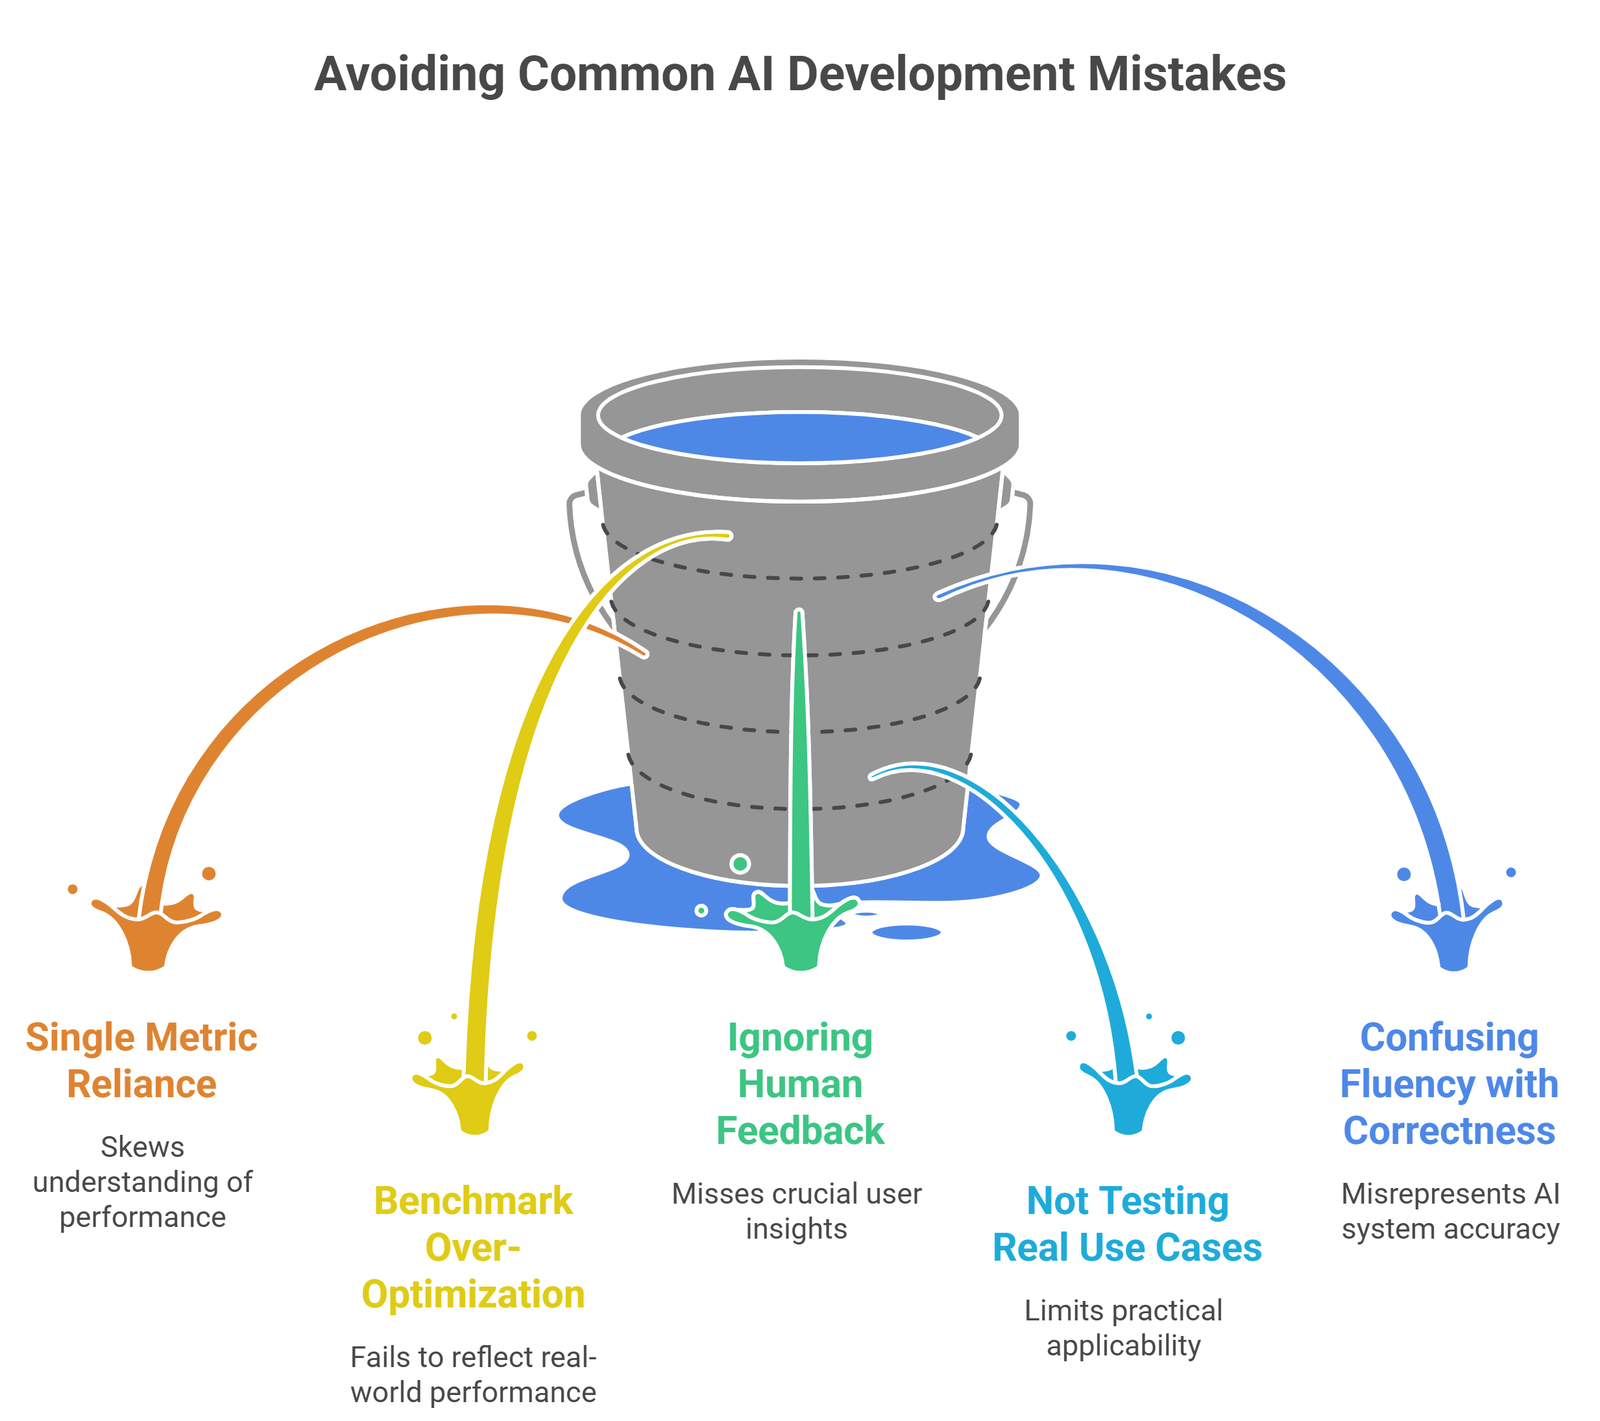
Many top-ranking blogs list metrics, but miss these practical pitfalls.
Objective Metrics for Measuring Helpfulness and Relevance
Moving past basic lexical matching requires tracking behavioral traits natively. When setting up systemic validations, engineers prioritize objective metrics for measuring helpfulness and relevance in llm responses over superficial syntax checks.
Fluency and Linguistic Correctness
If you are analyzing which evaluation metric measures linguistic correctness and natural language quality, the focus shifts to dedicated fluency metrics llm setups. These metrics evaluate token probability distributions and grammatical structures to confirm that generated text flows naturally, serving as a vital fluency metrics llm rag guardrail to ensure retrieved knowledge chunks integrate seamlessly into fluid, cohesive conversational text.
Comparing Enterprise AI Vendors for Accuracy
For corporate technology managers asking how do i compare enterprise ai vendors for accuracy, establishing a uniform llm evaluation scorecard benchmark is a critical procurement requirement.
Rather than trusting arbitrary vendor marketing sheets, teams run localized llm accuracy testing regimens over isolated internal validation datasets. Tracking custom metrics like llm f1 score thresholds on classification outputs alongside real-world llm evaluation latency profiles ensures you select an infrastructure node that balances computational intelligence depth with execution speed requirements.
Suggested Read:
- What Is a Large Language Model? Explained Simply
- How LLMs Work: Tokens, Context, and Inference
- Why LLMs Hallucinate and How to Reduce It
- Open Source LLMs vs Closed Models
- What Is RAG in AI? A Beginner-Friendly Guide
- Best LLMs for Coding in 2026
FAQ: LLM Evaluation Metrics
What is the most important LLM metric?
There is no single best metric. It depends on your use case.
Is perplexity enough?
No. It only measures language modeling, not usefulness.
Why is human evaluation important?
Because many aspects of quality cannot be measured automatically.
Are benchmarks reliable?
They are useful for comparison but not enough for real-world evaluation.
Final takeaway
LLM evaluation is not about finding one perfect score. It is about combining multiple signals to understand performance.
If you want reliable AI systems, focus less on benchmark numbers and more on how the model performs in real-world tasks.